The Total Sales by Pricing Group report lists information about sales by pricing group, broken down per group, during the specified time period. See below to run the report and view report results. You can also export the report and print it.
On the PAYD Administration main screen, click Reports.
On the Reports menu, click Inventory, then click Total Sales by Pricing Group.
The Total Sales by Pricing Group report screen appears.
Specify a time period by entering a Month, Day and Year in the Starting date and Ending date textboxes.
NOTE: The default time period is Today.
Click the View button.
Results appear below.
Click the Stores button.
On the Select Store(s) popup, select the checkboxes for the stores you want to include in the report and then click OK (all your stores are selected by default).
Click the View button.
Click the Start of day drop-down menu and select a starting time for the report results.
Click the End of day drop-down menu and select an end time for the report results.
Click the View button.
NOTE: The default setting for this report is the entire day (within the date range selected). To run the report for the entire day, leave the defaults set to Start of day and End of day. It is also possible to see results for specific times of the day. For example, if you wanted to see results between 9am and noon, you would enter a start time of 09:00 and an end time of 12:00. Then if you wanted to see results from 2pm to 5pm you would repeat steps 1-3 selecting a start time of 14:00 and an end time of 17:00. The time frame works on a 24-hour clock.
Click the Period drop-down menu and select the appropriate time period from the list e.g. Last Month.
Click the Show Options button on the top of the screen.
Click the radio button beside Selected channel(s) to choose the sales channel type that you wish to see on the report. All prints both eCommerce and POS channels.
NOTE: In this case, Channels refer to the method by which the sale was conducted. eCommerce indicates an online sale through your eCommerce website. POS indicates a sale made via checking a customer out through the POS view.
NOTE: If you do not have the eCommerce module, you will not see this option on the report.
Click the Print button above the results.
Refer to Printing Reports for more information.
Refer to Exporting Reports for more information.
The report results list matching sales/refunds within the specified time frame, broken down into sales by the individual pricing groups.
Pricing Group- The Pricing Group used in the transaction (default sort - click to view details).
Number of Sales - Number of Purchase transactions that involved the pricing group.
Qty Sold - Total quantity of items sold within the Purchase transactions that involved the pricing group.
Total Sales - Total dollar amount of sales of the Purchase transactions that involved the pricing group.
Number of Refunds - Total number of Refund transactions that involved the pricing group.
Qty Refunded - Total quantity of items refunded in transactions that involved the pricing group.
Total Refunds - Total dollar amount of Refunds of the Purchase transactions that involved the pricing group.
Discount - Total dollar amount of discounts taken off when the pricing group was used within the transaction.
Click the heading of the column you want to sort on (highlighted on mouseover).
Click again on a heading to toggle between descending and ascending order.
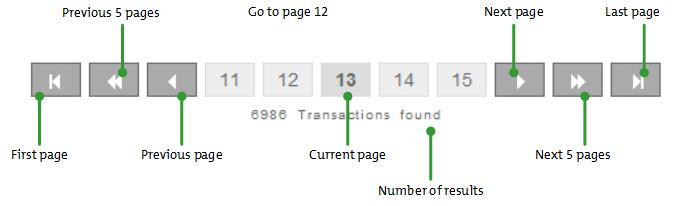
Use the navigation bar below the report results. The current page is highlighted.
The Pricing Group Management View